How to Perform Technical Analysis: Tools and Techniques for Traders

Introduction
Technical analysis is a cornerstone of trading, used by traders to evaluate and predict market movements based on historical price data and volume. Unlike fundamental analysis, which looks at the intrinsic value of an asset, technical analysis focuses on patterns and signals in the price chart. In this post, we’ll explore the essential tools and techniques of technical analysis that can help you make more informed trading decisions.
1. The Basics of Technical Analysis
Technical analysis is rooted in the belief that historical price movements are likely to repeat themselves due to market psychology. Here are the core principles:
- Market Action Discounts Everything: The idea that all known information is already reflected in the price, so there’s no need to analyze external factors like economic reports.
- Price Moves in Trends: Prices typically move in trends, which can be upward, downward, or sideways. Identifying these trends is key to making profitable trades.
- History Tends to Repeat Itself: Market patterns, driven by human emotions like fear and greed, tend to repeat over time.
2. Essential Tools for Technical Analysis
To effectively perform technical analysis, you’ll need to familiarize yourself with several key tools:
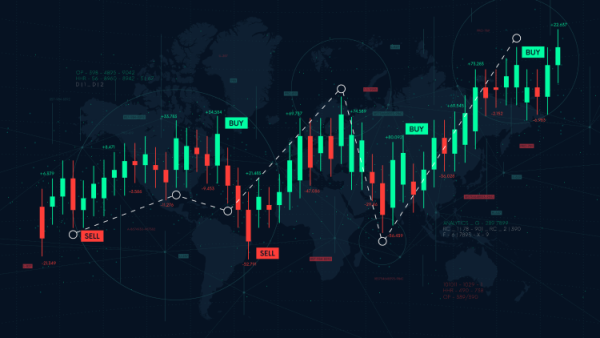
- Price Charts: The foundation of technical analysis, price charts visually represent the price movements of an asset over time. The most common types include line charts, bar charts, and candlestick charts.
- Trendlines: Trendlines help traders identify the direction of the market. An upward trendline is drawn by connecting the lows of the price movement, while a downward trendline connects the highs.
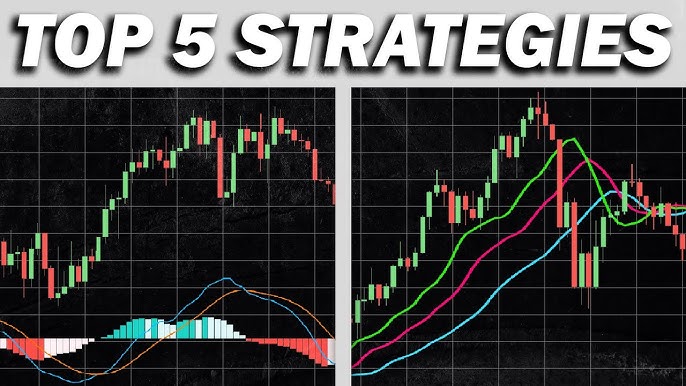
- Moving Averages: Moving averages smooth out price data to create a single flowing line, making it easier to identify the direction of the trend. The two most common types are the Simple Moving Average (SMA) and the Exponential Moving Average (EMA).
- Volume Indicators: Volume is the number of shares or contracts traded in a security or market. Volume indicators help confirm trends—if the price moves with high volume, it’s more likely to be sustained.
3. Popular Technical Indicators
Technical indicators are mathematical calculations based on price, volume, or open interest that traders use to predict future price movements. Here are some of the most popular ones:
- Relative Strength Index (RSI): The RSI is a momentum oscillator that measures the speed and change of price movements. It ranges from 0 to 100, with readings above 70 indicating overbought conditions and below 30 indicating oversold conditions.
- Moving Average Conindicator that shows the relationship between two moving averages of an asset’s price. It consists of the MACD line, the signal line, and a histogram. Traders use the MACD to identify potential buy and sell signals based on crossovers, divergences, and overbought/oversold conditions.
indicator that shows the relationship between two moving averages of a security’s price. It consists of the MACD line, the signal line, and the histogram, and helps identify changes in the strength, direction, and duration of a trend.
- Bollinger Bands: Bollinger Bands consist of a middle band (SMA) and two outer bands that are standard deviations away from the middle band. They help traders identify volatility and potential price levels for reversal or continuation.
- Fibonacci Retracement Levels: Fibonacci retracement levels are horizontal lines that indicate potential support and resistance levels based on the Fibonacci sequence. They are used to predict areas where the price might reverse or stall.
- Stochastic Oscillator: This momentum indicator compares a security’s closing price to its price range over a specific period. It helps identify overbought or oversold conditions by showing where the current price is relative to its range.
4. Chart Patterns
Chart patterns are formations created by the price movements on a chart and can signal potential future price movements. Some key patterns include:
- Head and Shoulders: A reversal pattern that indicates a change in trend direction. The head and shoulders pattern consists of three peaks: a higher peak (head) between two lower peaks (shoulders).
- Double Top and Double Bottom: Reversal patterns that signal a change in trend direction. A double top occurs after an uptrend and indicates a bearish reversal, while a double bottom occurs after a downtrend and signals a bullish reversal.
- Triangles: Triangular patterns, such as ascending, descending, and symmetrical triangles, indicate consolidation and potential continuation of the trend once the price breaks out of the triangle.
- Flags and Pennants: Continuation patterns that signal a brief consolidation before the previous trend resumes. Flags are rectangular-shaped, while pennants are small symmetrical triangles.
5. Using Technical Analysis in Your Trading Strategy
Incorporating technical analysis into your trading strategy involves:
- Identifying Trends: Use trendlines and moving averages to determine the direction of the market. Trade in the direction of the trend for better success rates.
- Spotting Entry and Exit Points: Use indicators and chart patterns to identify optimal entry and exit points. For example, entering a trade when an indicator signals overbought or oversold conditions.
- Combining Tools: Use a combination of technical indicators and chart patterns to confirm signals and reduce the risk of false positives.
- Backtesting: Test your technical analysis strategies using historical data to see how they would have performed in the past. This helps validate your approach and improve your trading plan.
6. The Limitations of Technical Analysis
While technical analysis is a valuable tool, it’s important to be aware of its limitations:
- Not Foolproof: Technical analysis does not guarantee future performance. Markets can be unpredictable, and signals can sometimes be misleading.
- Lagging Indicators: Many technical indicators are lagging, meaning they are based on past price movements and may not always accurately predict future trends.
- Requires Practice: Mastering technical analysis takes time and practice. It’s essential to continually learn and adapt your techniques.
Conclusion
Technical analysis is a powerful tool for traders looking to make informed decisions based on market data. By understanding and using price charts, indicators, and chart patterns, you can gain insights into market trends and potential trading opportunities. Remember, while technical analysis can enhance your trading strategy, it’s crucial to combine it with other approaches and always manage your risk.


Post Comment